We are hiring
Bez kategorii

How to Calculate Inventory and Accounts Payable Turnover

Jun 20, 2024

How to Calculate Inventory Turnover?

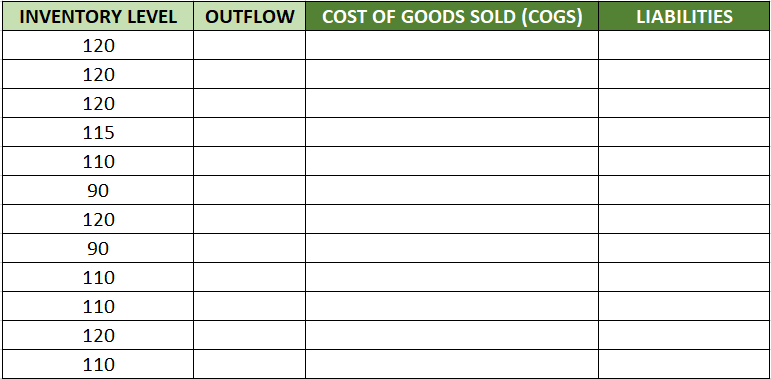
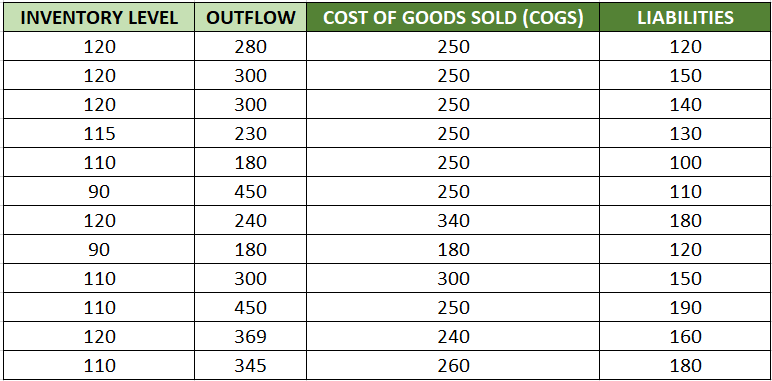
First, determine the period for which you want to calculate the indicator. It could be a quarter or a month. In our sample template, we use months. Enter the data for the average inventory level for the given month in the table, which can be expressed in quantities or values.

You can obtain average data from your ERP system. If you do not use this tool, assume that the average is the inventory level at the beginning and end of the month divided by 2. The more control points you have, the more accurate the average will be. Determine when the inventory level is most representative for the given month.

Next, fill in the “outflow” column. These data will differ depending on the monthly sales (for a trading company) or the usage of inventory for production (for a manufacturing company).

Now, use the formula to calculate the inventory turnover ratio. Divide the inventory level by the outflow in the given period and multiply by the number of days for that period (30 days for a month, 90 days for a quarter). The resulting figure represents the number of days the product typically remained in stock.

How to Calculate the Accounts Payable Turnover Ratio?

First, enter the data for the cost of goods sold (COGS) for the analyzed period. The easiest way to do this is by using a weighted average of expenses, although this is not the most precise method. Appropriate data can be obtained from the finance department. COGS includes costs such as raw materials, labor, additional services (e.g., maintenance, process engineers), and warehouse personnel.

Next, enter the value of liabilities, i.e., the amount of open payments to suppliers at a given time. These data can also be calculated using a weighted average, but more accurate data will be obtained from the finance department.

Calculate the accounts payable turnover ratio by dividing the value of liabilities by the cost of goods sold and multiplying by the number of days for the analyzed period (30 days for a month, 90 days for a quarter).

Analysis of Turnover Ratios

Below is a chart showing the accounts payable turnover and inventory turnover along with their trend. The black line indicates the value of accounts payable turnover in days, measured over successive months (average payment term to suppliers). The blue line represents inventory turnover (the time it takes for goods to be consumed after being delivered by the supplier).

By analyzing the chart, you will notice that a positive contribution to the company’s liquidity occurs when the blue line is below the black line. This means that cash remains in the company longer before payment. Conversely, when the lines intersect and inventory turnover is higher than accounts payable turnover, payment for goods occurs before they are consumed, which negatively impacts the company’s liquidity.

Pay attention to the trend. In the given example, the trend of “aging” products is lengthening. This may be related to seasonality, increased customer orders, or other objective reasons. Trends will vary depending on the company profile—manufacturing, services, etc.

Remember, we measure indicators to capture trends. This is crucial as it enhances the awareness of business decisions during negotiations with suppliers or internal partners.